Recently played with the Spring/SpringBoot/SpringCloud stack with a toy project: https://github.com/gonwan/spring-cloud-demo. Just paste README.md here, and any pull request is welcome:
Switch from Postgres to MySQL, and from Kafka to RabbitMQ.
Easier local debugging by switching off service discovery and remote config file lookup.
Kubernetes support.
Swagger Integration.
Spring Boot Admin Integration.
The project includes:
[eureka-server]: Service for service discovery. Registered services are shown on its web frontend, running at 8761 port.
[config-server]: Service for config file management. Config files can be accessed via: http://${config-server}:8888/${appname}/${profile}. Where ${appname} is spring.application.name and ${profile} is something like dev, prd or default.
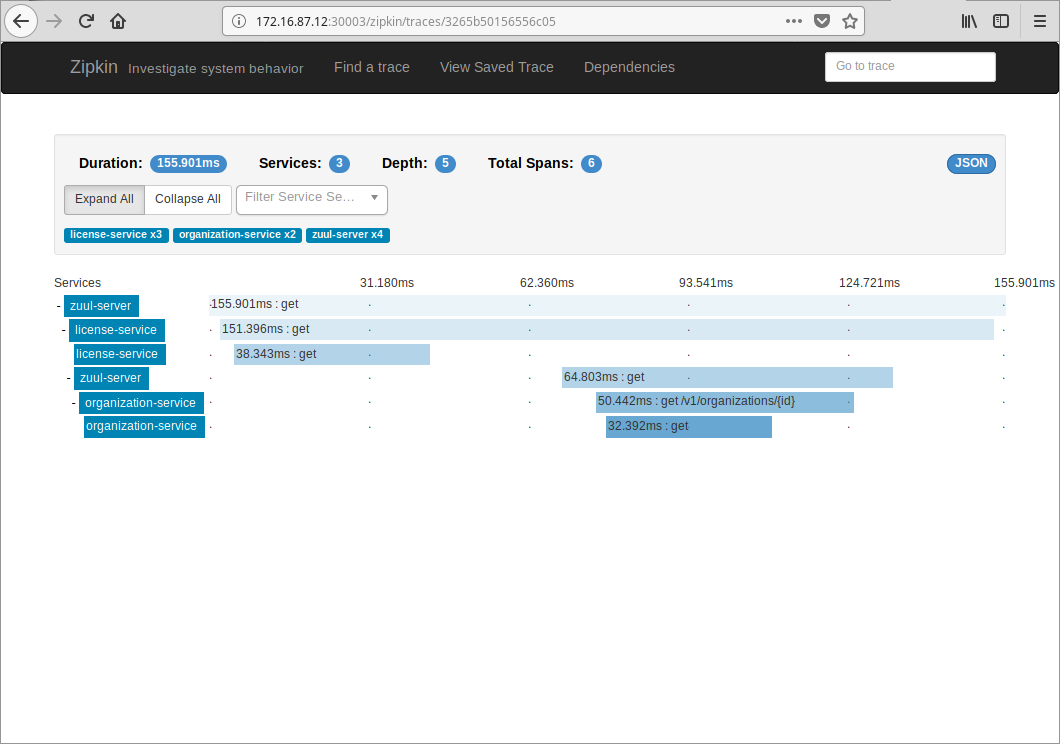
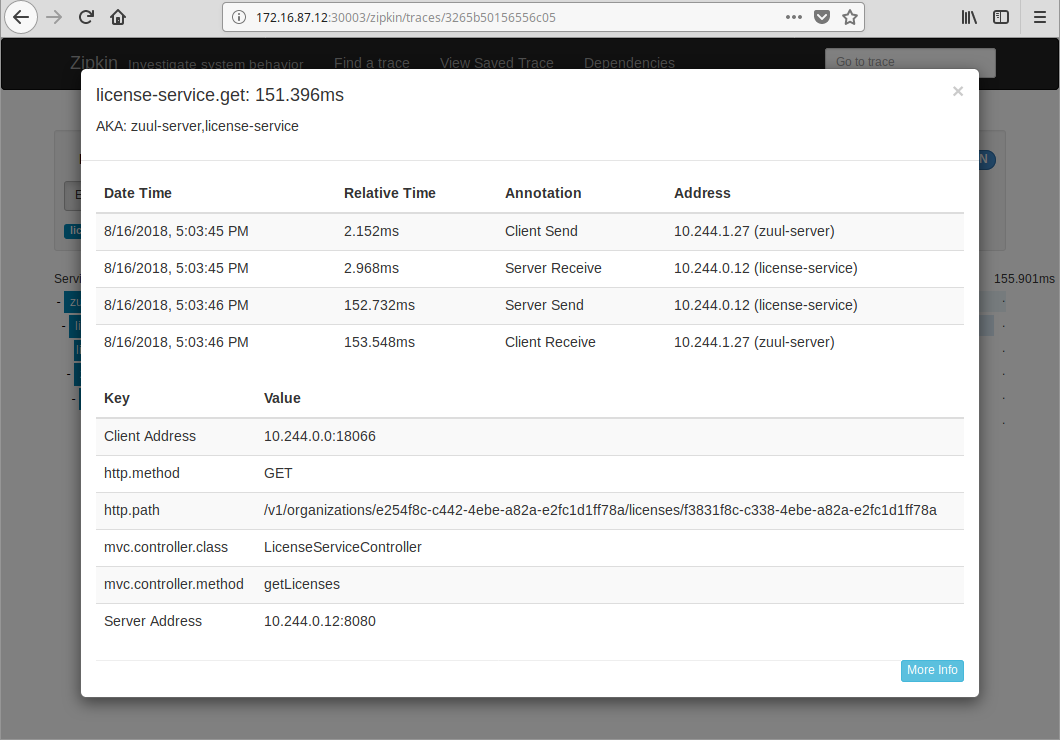
[zipkin-server]: Service to aggregate distributed tracing data, working with spring-cloud-sleuth. It runs at 9411 port. All cross service requests, message bus delivery are traced by default.
[zuul-server]: Gateway service to route requests, running at 5555 port.
[authentication-service]: OAuth2 enabled authentication service running at 8901. Redis is used for token cache. JWT support is also included. Spring Cloud Security 2.0 saves a lot when building this kind of services.
[organization-service]: Application service holding organization information, running at 8085. It also acts as an OAuth2 client to authentication-service for authorization.
[license-service]: Application service holding license information, running at 8080. It also acts as an OAuth2 client to authentication-service for authorization.
[config]: Config files hosted to be accessed by config-server.
[docker]: Docker compose support.
[kubernetes]: Kubernetes support.
NOTE: The new OAuth2 support in Spring is actively being developed. All functions are merging into core Spring Security 5. As a result, current implementation is suppose to change. See:
Every response contains a correlation ID to help diagnose possible failures among service call. Run with curl -v to get it:
1
2
3
4
# curl -v ...
...
<sc-correlation-id:3265b50156556c05
...
Search it in Zipkin to get all trace info, including latencies if you are interested in.
The license service caches organization info in Redis, prefixed with organizations:. So you may want to clear them to get a complete tracing of cross service invoke.
All OAuth2 tokens are cached in Redis, prefixed with oauth2:. There is also JWT token support. Comment/Uncomment @Configuration in AuthorizationServerConfiguration and JwtAuthorizationServerConfiguration classes to switch it on/off.
Swagger Integration
The organization service and license service have Swagger integration. Access via /swagger-ui.html.
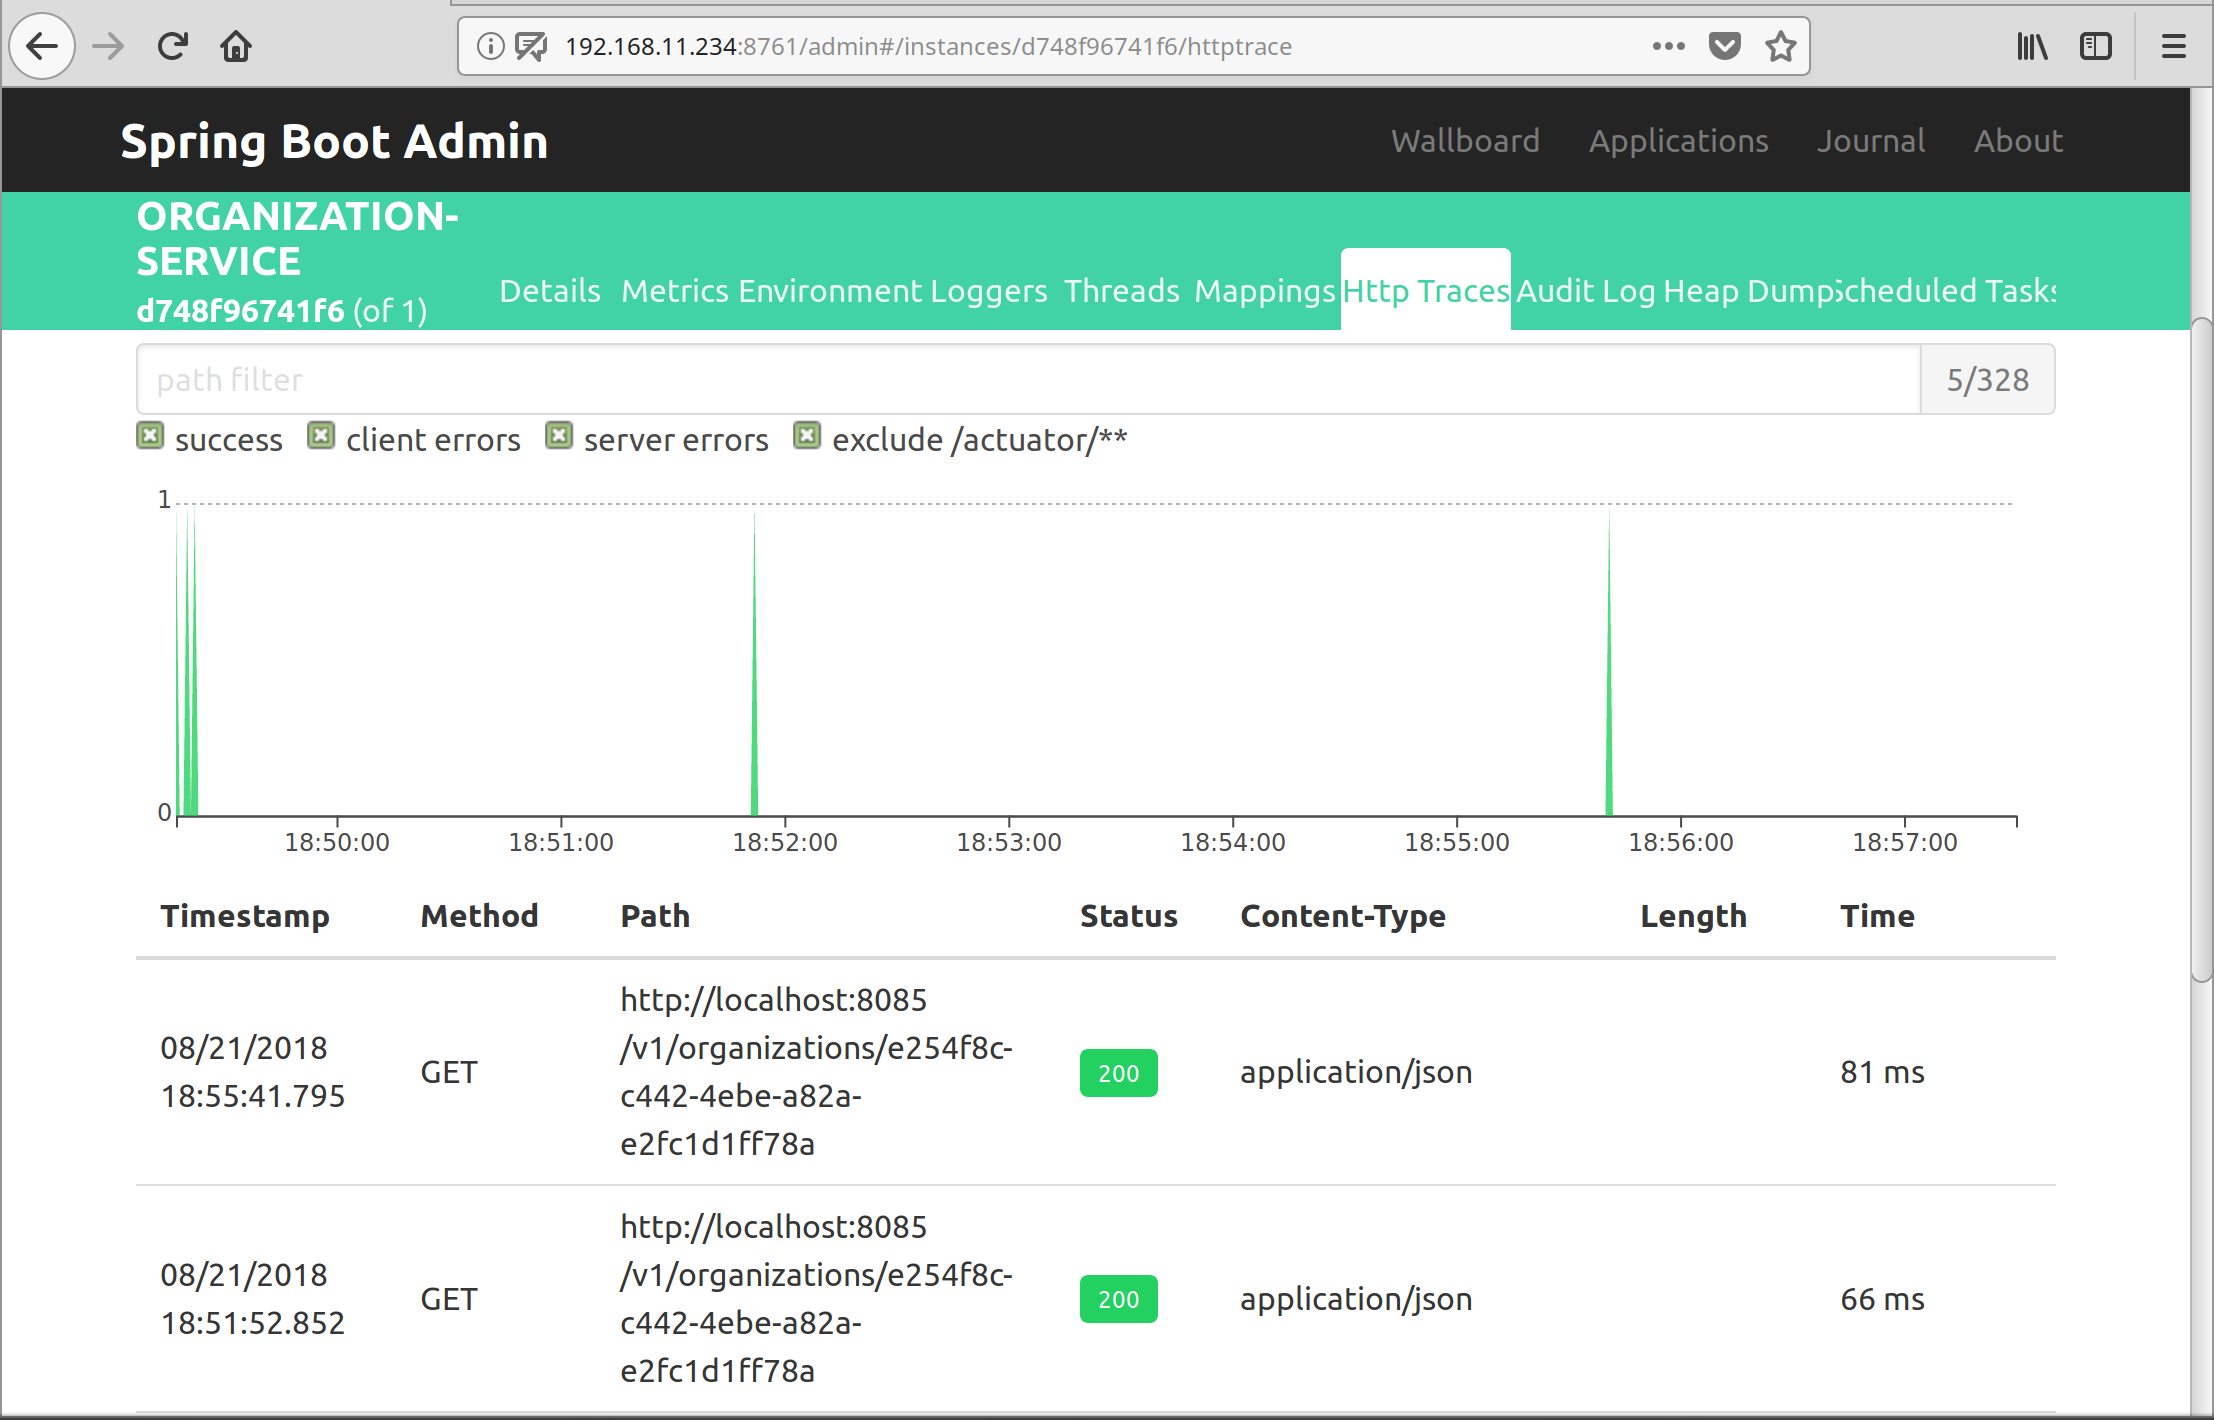
Spring Boot Admin Integration
Spring Boot Admin is integrated into the eureka server. Access via: http://${eureka-server}:8761/admin.
It is painful to deploying a Kubernetes cluster in mainland China. The installation requires access to Google servers, which is not so easy for every one. Fortunately, there are mirrors or alternative ways. I’ll use Docker v1.13 and Kubernetes v1.11 in the article.
Run the init command by specify the version, the access to Google server is avoided. The script also advices you to turn off firewalld, swap, selinux and enable kernel parameters:
1
2
3
4
# systemctl stop firewalld
# systemctl disable firewalld
# swapoff -a
# setenforce 0
Open /etc/sysconfig/selinux, change enforcing to permissive.
Create /etc/sysctl.d/k8s.conf with content:
1
2
net.bridge.bridge-nf-call-ip6tables=1
net.bridge.bridge-nf-call-iptables=1
1
# sysctl --system
Remember to comment out swap volumes from /etc/fstab.
2.3 Pull Kubernates images
Pull the Kubernetes images from docker/docker-cn mirror maintained by anjia0532. These are minimal images required for a Kubernetes master installation.
These version numbers comes from the kubeadm init command if you cannot access Google servers. These images should be retagged to gcr.io ones before next steps, or the kubeadm command line would not find them:
1
2
3
4
5
6
7
# docker tag registry.docker-cn.com/anjia0532/google-containers.kube-apiserver-amd64:v1.11.1 k8s.gcr.io/kube-apiserver-amd64:v1.11.1
# docker tag registry.docker-cn.com/anjia0532/google-containers.kube-controller-manager-amd64:v1.11.1 k8s.gcr.io/kube-controller-manager-amd64:v1.11.1
# docker tag registry.docker-cn.com/anjia0532/google-containers.kube-scheduler-amd64:v1.11.1 k8s.gcr.io/kube-scheduler-amd64:v1.11.1
# docker tag registry.docker-cn.com/anjia0532/google-containers.kube-proxy-amd64:v1.11.1 k8s.gcr.io/kube-proxy-amd64:v1.11.1
# docker tag registry.docker-cn.com/anjia0532/google-containers.pause:3.1 k8s.gcr.io/pause:3.1
# docker tag registry.docker-cn.com/anjia0532/google-containers.etcd-amd64:3.2.18 k8s.gcr.io/etcd-amd64:3.2.18
# docker tag registry.docker-cn.com/anjia0532/google-containers.coredns:1.1.3 k8s.gcr.io/coredns:1.1.3
Now, you can access with: http://<master-ip>:31023/.
You can grant admin grant full admin privileges to Dashboard’s Service Account in the development environment for convenience:
1
2
3
4
5
6
7
8
9
10
11
12
13
14
15
16
# cat dashboard-admin.yaml
apiVersion:rbac.authorization.k8s.io/v1beta1
kind:ClusterRoleBinding
metadata:
name:kubernetes-dashboard
labels:
k8s-app:kubernetes-dashboard
roleRef:
apiGroup:rbac.authorization.k8s.io
kind:ClusterRole
name:cluster-admin
subjects:
-kind:ServiceAccount
name:kubernetes-dashboard
namespace:kube-system
# kubectl create -f dashboard-admin.yaml
5. Troubleshoting
In my office environment, errors occur and the coredns are always in CrashLoopBackOff status:
I Googled a lot, read answers from Stackoverflow and Github, reset iptables/docker/kubernetes, but still failed to solve it. There ARE unresolved issues like #60315. So I tried to switch to flannel network instead of weave. First, Kubernetes and weave need to be reset:
deb https://mirrors.aliyun.com/kubernetes/apt/ kubernetes-xenial main
EOF
Updated June 3, 2019: flannel seems to have a close version dependency on kubernetes version. When deploying kubernetes 1.14, a specific git version should be used, according to the official document:
Updated Jan 11, 2022: Just deployed a new cluster with docker 20.10.12 & kubernetes 1.23.1.
1. kubeadm defaults to systemd, instead of cgroupfs as the container runtime cgroup driver. In docker case, edit /etc/docker/daemon.json, and restart docker service:
Go to Menu –> Store –> Check for Available Downloads, to refresh your iBooks login manually. Also make sure the iCloud option for iBooks is enabled in settings.
Updated July 4, 2022: On MacOS 12, Go to Settings –> Apple ID —> iCloud Drive, disable and re-enable the iBooks sync. If this does not work, logout and re-login the Apple ID.
UPDATE: Some of the language in the original post was considered overly-critical of Oracle by some community members. This was not my intent, and I’ve modified the language to be less so. I’ve also changed term “synchronous” (which the use of is inaccurate and misleading) to “virtually synchronous.” This term is more accurate and already used by both technologies’ founders, and should be less misleading.
I also wanted to thank Jean-François Gagné for pointing out the incorrect sentence about multi-threaded slaves in Group Replication, which I also corrected accordingly.
In today’s blog post, I will briefly compare two major virtually synchronous replication technologies available today for MySQL.
More Than Asynchronous Replication
Thanks to the Galera plugin, founded by the Codership team, we’ve had the choice between asynchronous and virtually synchronous replication in the MySQL ecosystem for quite a few years already. Moreover, we can choose between at least three software providers: Codership, MariaDB and Percona, each with its own Galera implementation.
Oracle, the upstream MySQL provider, introduced its own replication implementation that is very similar in concept. Unlike the others mentioned above, it isn’t based on Galera. Group Replication was built from the ground up as a new solution. MySQL Group Replication shares many very similar concepts to Galera. This post doesn’t cover MySQL Cluster, another and fully-synchronous solution, that existed much earlier then Galera — it is a much different solution for different use cases.
In this post, I will point out a couple of interesting differences between Group Replication and Galera, which hopefully will be helpful to those considering switching from one to another (or if they are planning to test them).
This is certainly not a full list of all the differences, but rather things I found interesting during my explorations.
It is also important to know that Group Replication has evolved a lot before it went GA (its whole cluster layer was replaced). I won’t mention how things looked before the GA stage, and will just concentrate on latest available 5.7.17 version. I will not spend too much time on how Galera implementations looked in the past, and will use Percona XtraDB Cluster 5.7 as a reference.
Multi-Master vs. Master-Slave
Galera has always been multi-master by default, so it does not matter to which node you write. Many users use a single writer due to workload specifics and multi-master limitations, but Galera has no single master mode per se.
Group Replication, on the other hand, promotes just one member as primary (master) by default, and other members are put into read-only mode automatically. This is what happens if we try to change data on non-master node:
To change from single primary mode to multi-primary (multi-master), you have to start group replication with the group_replication_single_primary_mode variable disabled.
Another interesting fact is you do not have any influence on which cluster member will be the master in single primary mode: the cluster auto-elects it. You can only check it with a query:
Galera delivers write transactions synchronously to ALL nodes in the cluster. (Later, applying happens asynchronously in both technologies.) However, Group Replication needs just a majority of the nodes confirming the transaction. This means a transaction commit on the writer succeeds and returns to the client even if a minority of nodes still have not received it.
In the example of a three-node cluster, if one node crashes or loses the network connection, the two others continue to accept writes (or just the primary node in Single-Primary mode) even before a faulty node is removed from the cluster.
If the separated node is the primary one, it denies writes due to the lack of a quorum (it will report the error ERROR 3101 (HY000): Plugin instructed the server to rollback the current transaction.). If one of the nodes receives a quorum, it will be elected to primary after the faulty node is removed from the cluster, and will then accept writes.
With that said, the “majority” rule in Group Replication means that there isn’t a guarantee that you won’t lose any data if the majority nodes are lost. There is a chance these could apply some transactions that aren’t delivered to the minority at the moment they crash.
In Galera, a single node network interruption makes the others wait for it, and pending writes can be committed once either the connection is restored or the faulty node removed from cluster after the timeout. So the chance of losing data in a similar scenario is lower, as transactions always reach all nodes. Data can be lost in Percona XtraDB Cluster only in a really bad luck scenario: a network split happens, the remaining majority of nodes form a quorum, the cluster reconfigures and allows new writes, and then shortly after the majority part is damaged.
Schema Requirements
For both technologies, one of the requirements is that all tables must be InnoDB and have a primary key. This requirement is now enforced by default in both Group Replication and Percona XtraDB Cluster 5.7. Let’s look at the differences.
Before Percona XtraDB Cluster 5.7 (or in other Galera implementations), there were no such enforced restrictions. Users unaware of these requirements often ended up with problems.
2017-01-15T22:48:25.241119Z139[ERROR]Plugingroup_replicationreported:'Table nopk does not have any PRIMARY KEY. This is not compatible with Group Replication'
I am not aware of any way to disable these restrictions in Group Replication.
GTID
Galera has it’s own Global Transaction ID, which has existed since MySQL 5.5, and is independent from MySQL’s GTID feature introduced in MySQL 5.6. If MySQL’s GTID is enabled on a Galera-based cluster, both numerations exist with their own sequences and UUIDs.
Group Replication is based on a native MySQL GTID feature, and relies on it. Interestingly, a separate sequence block range (initially 1M) is pre-assigned for each cluster member.
WAN Support
The MySQL Group Replication documentation isn’t very optimistic on WAN support, claiming that both “Low latency, high bandwidth network connections are a requirement” and “Group Replication is designed to be deployed in a cluster environment where server instances are very close to each other, and is impacted by both network latency as well as network bandwidth.” These statements are found here and here. However there is network traffic optimization: Message Compression.
I don’t see group communication level tunings available yet, as we find in the Galera evs.* series of wsrep_provider_options.
But both technologies need a reliable network for good performance.
State Transfers
Galera has two types of state transfers that allow syncing data to nodes when needed: incremental (IST) and full (SST). Incremental is used when a node has been out of a cluster for some time, and once it rejoins the other nodes has the missing write sets still in Galera cache. Full SST is helpful if incremental is not possible, especially when a new node is added to the cluster. SST automatically provisions the node with fresh data taken as a snapshot from one of the running nodes (donor). The most common SST method is using Percona XtraBackup, which takes a fast and non-blocking binary data snapshot (hot backup).
In Group Replication, state transfers are fully based on binary logs with GTID positions. If there is no donor with all of the binary logs (included the ones for new nodes), a DBA has to first provision the new node with initial data snapshot. Otherwise, the joiner will fail with a very familiar error:
MySQL
1
2017-01-16T23:01:40.517372Z50[ERROR]SlaveI/Oforchannel'group_replication_recovery':Gotfatalerror1236frommasterwhenreadingdatafrombinarylog:'The slave is connecting using CHANGE MASTER TO MASTER_AUTO_POSITION = 1, but the master has purged binary logs containing GTIDs that the slave requires.',Error_code:1236
The official documentation mentions that provisioning the node before adding it to the cluster may speed up joining (the recovery stage). Another difference is that in the case of state transfer failure, a Galera joiner will abort after the first try, and will shutdown its mysqld instance. The Group Replication joiner will then fall-back to another donor in an attempt to succeed. Here I found something slightly annoying: if no donor can satisfy joiner demands, it will still keep trying the same donors over and over, for a fixed number of attempts:
2017-01-16T22:57:38.329541Z12[Note]Plugin group_replication reported:'Establishing group recovery connection with a possible donor. Attempt 1/10'
2017-01-16T22:57:38.539984Z12[Note]Plugin group_replication reported:'Retrying group recovery connection with another donor. Attempt 2/10'
2017-01-16T22:57:38.806862Z12[Note]Plugin group_replication reported:'Retrying group recovery connection with another donor. Attempt 3/10'
2017-01-16T22:58:39.024568Z12[Note]Plugin group_replication reported:'Retrying group recovery connection with another donor. Attempt 4/10'
2017-01-16T22:58:39.249039Z12[Note]Plugin group_replication reported:'Retrying group recovery connection with another donor. Attempt 5/10'
2017-01-16T22:59:39.503086Z12[Note]Plugin group_replication reported:'Retrying group recovery connection with another donor. Attempt 6/10'
2017-01-16T22:59:39.736605Z12[Note]Plugin group_replication reported:'Retrying group recovery connection with another donor. Attempt 7/10'
2017-01-16T23:00:39.981073Z12[Note]Plugin group_replication reported:'Retrying group recovery connection with another donor. Attempt 8/10'
2017-01-16T23:00:40.176729Z12[Note]Plugin group_replication reported:'Retrying group recovery connection with another donor. Attempt 9/10'
2017-01-16T23:01:40.404785Z12[Note]Plugin group_replication reported:'Retrying group recovery connection with another donor. Attempt 10/10'
After the last try, even though it fails, mysqld keeps running and allows client connections…
Auto Increment Settings
Galera adjusts the auto_increment_increment and auto_increment_offset values according to the number of members in a cluster. So, for a 3-node cluster, auto_increment_increment will be “3” and auto_increment_offset from “1” to “3” (depending on the node). If a number of nodes change later, these are updated immediately. This feature can be disabled using the wsrep_auto_increment_control setting. If needed, these settings can be set manually.
Interestingly, in Group Replication the auto_increment_increment seems to be fixed at 7, and only auto_increment_offset is set differently on each node. This is the case even in the default Single-Primary mode! this seems like a waste of available IDs, so make sure that you adjust the group_replication_auto_increment_increment setting to a saner number before you start using Group Replication in production.
Multi-Threaded Slave Side Applying
Galera developed its own multi-threaded slave feature, even in 5.5 versions, for workloads that include tables in the same database. It is controlled with the wsrep_slave_threads variable. Group Replication uses a feature introduced in MySQL 5.7, where the number of applier threads is controlled with slave_parallel_workers. Galera will do multi-threaded replication based on potential conflicts of changed/locked rows. Group Replication parallelism is based on an improved LOGICAL_CLOCK scheduler, which uses information from writesets dependencies. This can allow it to achieve much better results than in normal asynchronous replication MTS mode. More details can be found here: http://mysqlhighavailability.com/zooming-in-on-group-replication-performance/
Flow Control
Both technologies use a technique to throttle writes when nodes are slow in applying them. Interestingly, the default size of the allowed applier queue in both is much different:
gcs.fc_limit (Galera) = 16 (the limit is increased automatically based on number of nodes, i.e. to 28 in 3-node cluster) group_replication_flow_control_applier_threshold (Group Replication) = 25000.
Moreover, Group Replication provides separate certifier queue size, also eligible for the Flow Control trigger: group_replication_flow_control_certifier_threshold. One thing I found difficult, is checking the actual applier queue size, as the only exposed one via performance_schema.replication_group_member_stats is the Count_Transactions_in_queue (which only shows the certifier queue).
Network Hiccup/Partition Handling
In Galera, when the network connection between nodes is lost, those who still have a quorum will form a new cluster view. Those who lost a quorum keep trying to re-connect to the primary component. Once the connection is restored, separated nodes will sync back using IST and rejoin the cluster automatically.
This doesn’t seem to be the case for Group Replication. Separated nodes that lose the quorum will be expelled from the cluster, and won’t join back automatically once the network connection is restored. In its error log we can see:
MySQL
1
2
3
4
5
6
7
2017-01-17T11:12:18.562305Z0[ERROR]Plugingroup_replicationreported:'Member was expelled from the group due to network failures, changing member status to ERROR.'
Note that in the above output, after the network failure, Group Replication did not stop. It waits in an error state. Moreover, in Group Replication a partitioned node keeps serving dirty reads as if nothing happened (for non-super users):
In a Galera-based cluster, you are automatically protected from that, and a partitioned node refuses to allow both reads and writes. It throws an error: ERROR 1047 (08S01): WSREP has not yet prepared node for application use. You can force dirty reads using the wsrep_dirty_reads variable.
There many more subtle (and less subtle) differences between these technologies – but this blog post is long enough already. Maybe next time 🙂
Adopting to using Spring Data JPA these day, there is a post saying: IDENTITY generator disables JDBC batch inserts. To figure out the impact, create a table with 10 data fields and an auto-increment id for testing. I am using MySQL 5.7.20 / MariaDB 10.3.3 / Spring Data JPA 1.11.8 / Hibernate 5.0.12.
MySQL
1
2
3
4
5
6
7
8
9
10
11
12
13
14
CREATETABLE`t_user`(
`id`int(11)NOT NULLAUTO_INCREMENT,
`field1`varchar(255)DEFAULTNULL,
`field2`varchar(255)DEFAULTNULL,
`field3`varchar(255)DEFAULTNULL,
`field4`varchar(255)DEFAULTNULL,
`field5`varchar(255)DEFAULTNULL,
`field6`varchar(255)DEFAULTNULL,
`field7`varchar(255)DEFAULTNULL,
`field8`varchar(255)DEFAULTNULL,
`field9`varchar(255)DEFAULTNULL,
`field10`varchar(255)DEFAULTNULL,
PRIMARY KEY(`id`)
)ENGINE=InnoDBDEFAULTCHARSET=utf8;
And generate the persistence entity, add @GeneratedValue annotation:
As mentioned, Hibernate/JPA disables batch insert when using IDENTITY. Look into org.hibernate.event.internal.AbstractSaveEventListener#saveWithGeneratedId() for details. To make it clear, it DOES run faster when insert multiple entities in one transaction than in separated transactions. It saves transaction overhead, not round-trip overhead.
The generated key is eventually retrieved from java.sql.Statement#getGeneratedKeys(). And datasource-proxy is used to display the underlining SQL generated.
2. TABLE
Now switch to GenerationType.TABLE. Just uncomment the corresponding @GeneratedValue and @TableGenerator annotation. Result looks like:
I began to think that was the whole story for batch, and the datasource-proxy interceptor also traced down the batch SQL. But after I looked into dumped TCP packages using wireshark, I found the final SQL was still not in batch format. Say, they were in:
The latter one saves client/server round-trips and is recommended by MySQL. After adding rewriteBatchedStatements=true to my connection string, MySQL generated batch statements and result was much improved:
Last switch to GenerationType.SEQUENCE. Sequence is a new feature added in MariaDB 10.3 series. Create a sequence in MariaDB with:
MySQL
1
CREATESEQUENCE`s_user`STARTWITH1INCREMENTBY100;
Generally, the increment should match the one specified in @SequenceGenerator, at least >= allocationSize. See org.hibernate.id.enhanced.PooledOptimizer#generate().
Hibernate apparently does not support the new feature, I dealt with it by adding a new dialect:
Java
1
2
3
4
5
6
7
8
9
10
11
12
13
14
15
16
17
18
19
20
21
22
23
24
25
26
27
28
29
30
packagecom.gonwan.spring;
importorg.hibernate.dialect.MySQL5Dialect;
/*
* Copied from org.hibernate.dialect.PostgreSQL81Dialect.
supportsSequences() adds the sequence support. supportsPooledSequences() adds some pool-like optimization both supported by MariaDB and Hibernate. Otherwise, Hibernate uses tables to mimic sequences. Refer to org.hibernate.id.enhanced.SequenceStyleGenerator#buildDatabaseStructure(). Result with and without batch:
Dramatically improved when compared to the table generator. A sequence generator uses cache in memory(default 1000), and is optimized to eliminate lock when generating IDs.
4. Summary
1 thread
2 threads
4 threads
8 threads
16 threads
32 threads
IDENTITY
823
609
1188
2329
4577
9579
TABLE
830
854
1775
3479
6542
13768
TABLE with batch
433
409
708
1566
2926
6388
SEQUENCE
723
615
1147
2195
4687
9312
SEQUENCE with batch
298
155
186
356
695
1545
From the summary table, IDENTITY is simplest. TABLE is a compromise to support batch insert. And SEQUENCE yields the best performance. Find the entire project in Github.